
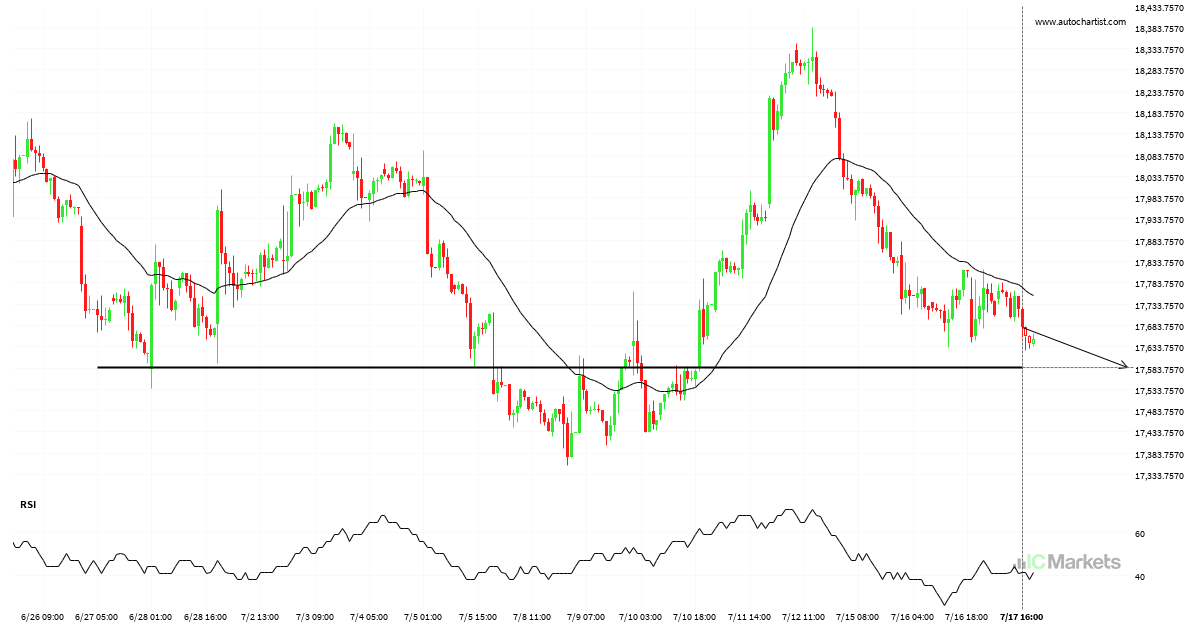
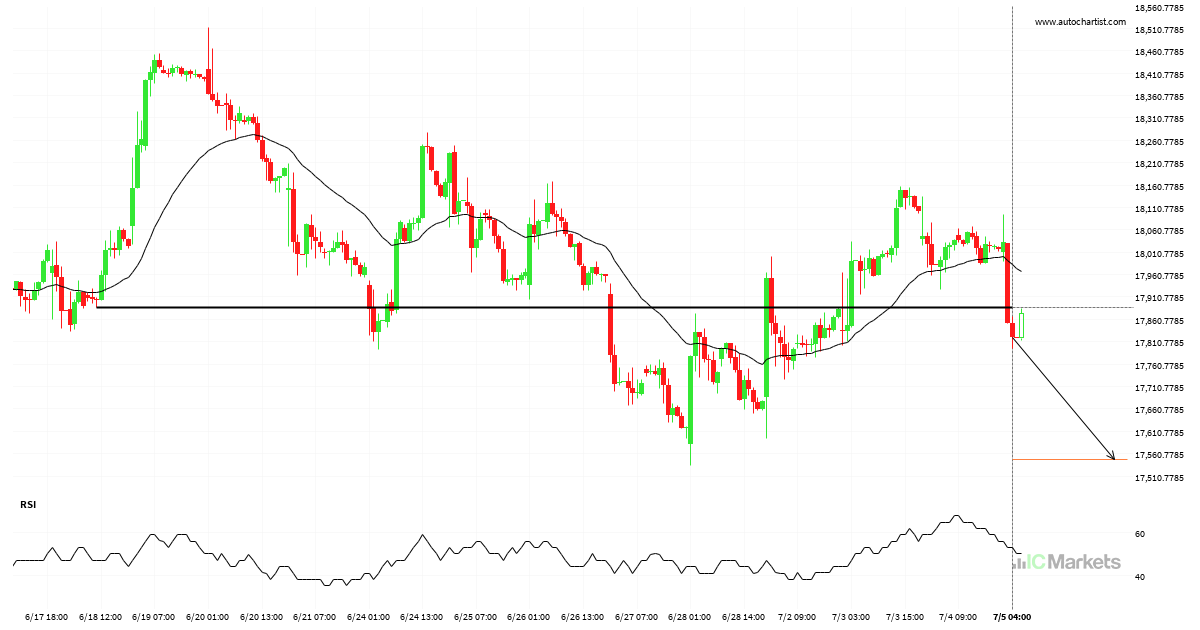
Breach of important price line imminent by Hong Kong 50 Index
The movement of Hong Kong 50 Index towards 17584.2891 price line is yet another test of the line it reached numerous times in the past. We could expect this test to happen in the next 3 days, but it is uncertain whether it will result in a breakout through this line, or simply rebound back […]
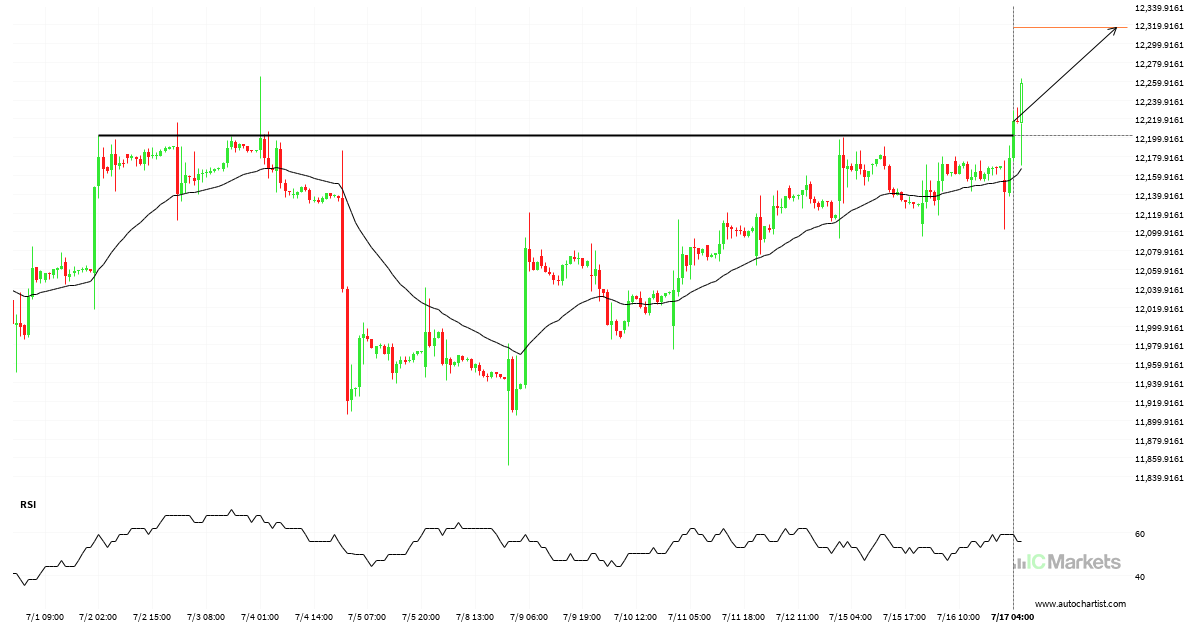
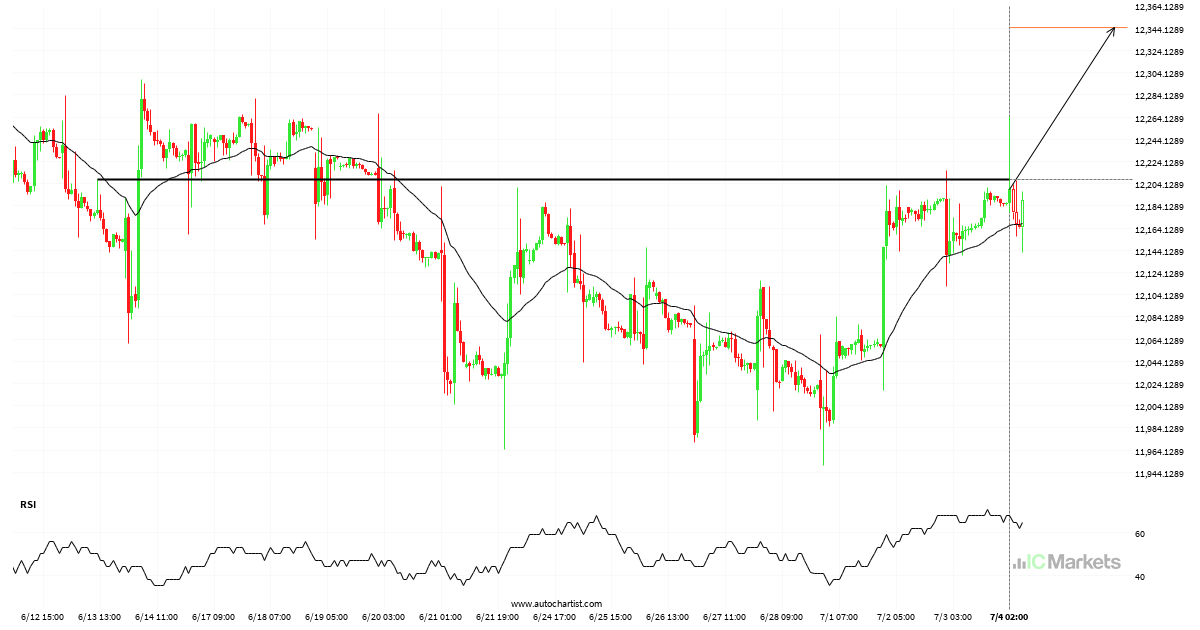
Resistance breakout on FTSE China A50 Index
FTSE China A50 Index is once again retesting a key horizontal resistance level at 12202.7305. It has tested this level 7 times in the recent past and could simply bounce off like it did last time. However, after this many tries, maybe it’s ready to start a new trend.
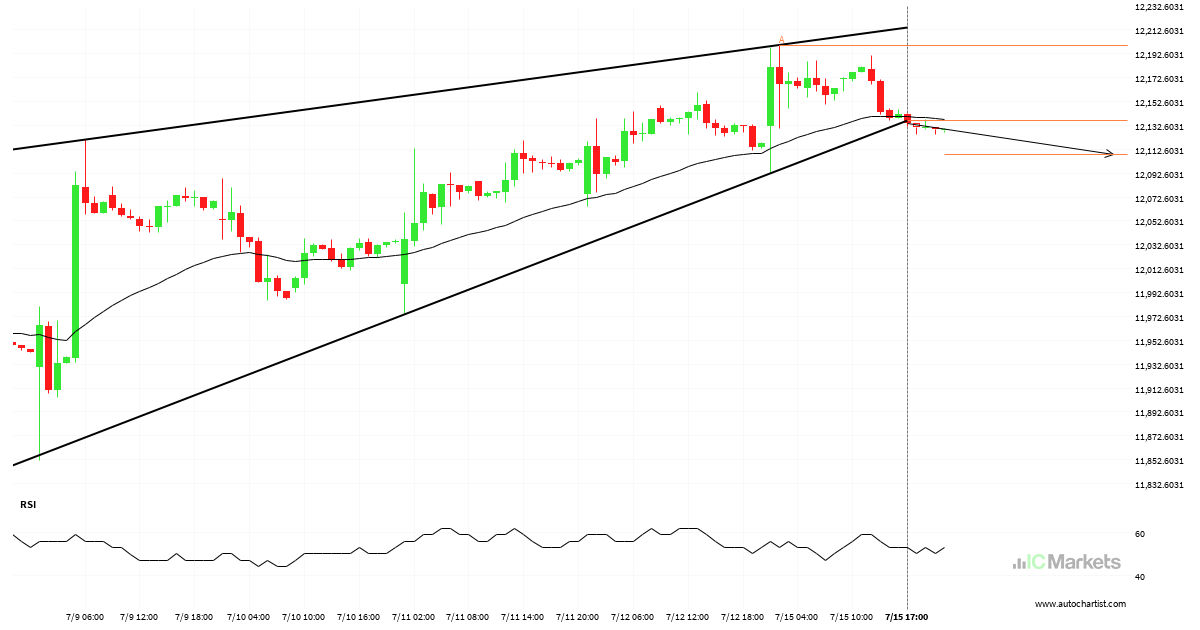
FTSE China A50 Index trade outlook at 2024-07-15T18:00:00.000Z until 2024-07-15T18:00:00.000Z
The last 7 1 hour candles on FTSE China A50 Index formed a Rising Wedge pattern and broken out through the pattern lines, indicating a possible bearish movement towards the price level of 12108.2736.
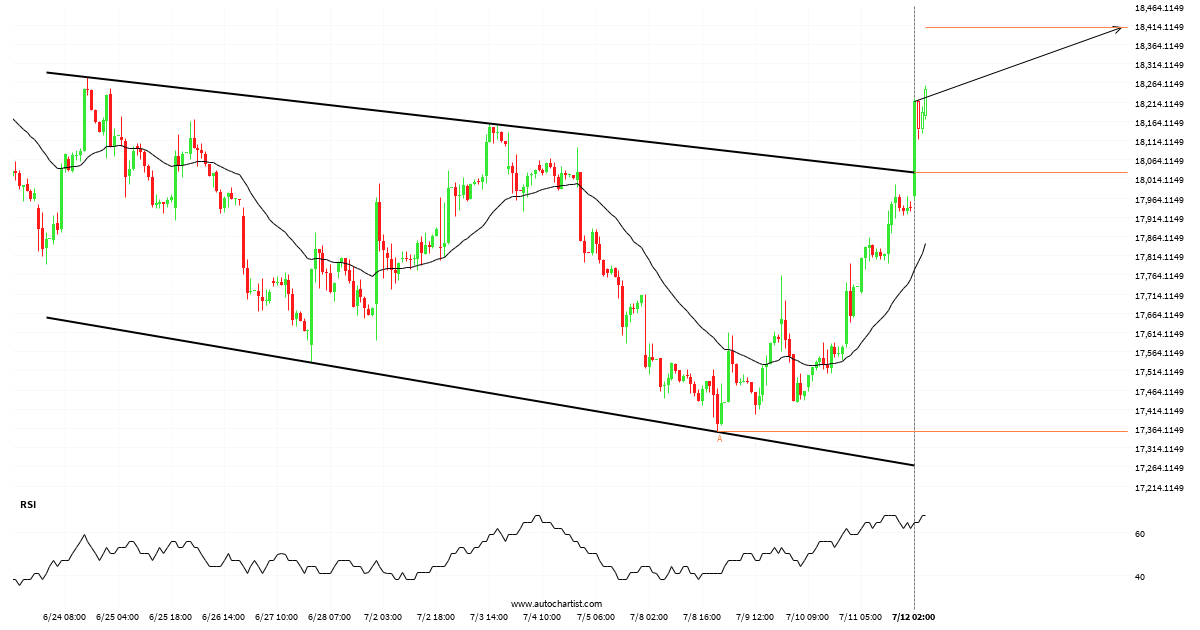
Hong Kong 50 Index trade outlook at 2024-07-12T03:00:00.000Z until 2024-07-12T03:00:00.000Z
The last 18 1 hour candles on Hong Kong 50 Index formed a Channel Down pattern and broken out through the pattern lines, indicating a possible bullish movement towards the price level of 18407.1934.

Continuation pattern on Hong Kong 50 Index
Triangle pattern identified on Hong Kong 50 Index has broken through a resistance level with the price momentum continuing to move in an upward direction. A solid trading opportunity continues with the price expected to reach 17817.1177 in the next 19.

FTSE China A50 Index approaching important level of 12157.9199
The movement of FTSE China A50 Index towards 12157.9199 price line is yet another test of the line it reached numerous times in the past. We could expect this test to happen in the next 3 days, but it is uncertain whether it will result in a breakout through this line, or simply rebound back […]
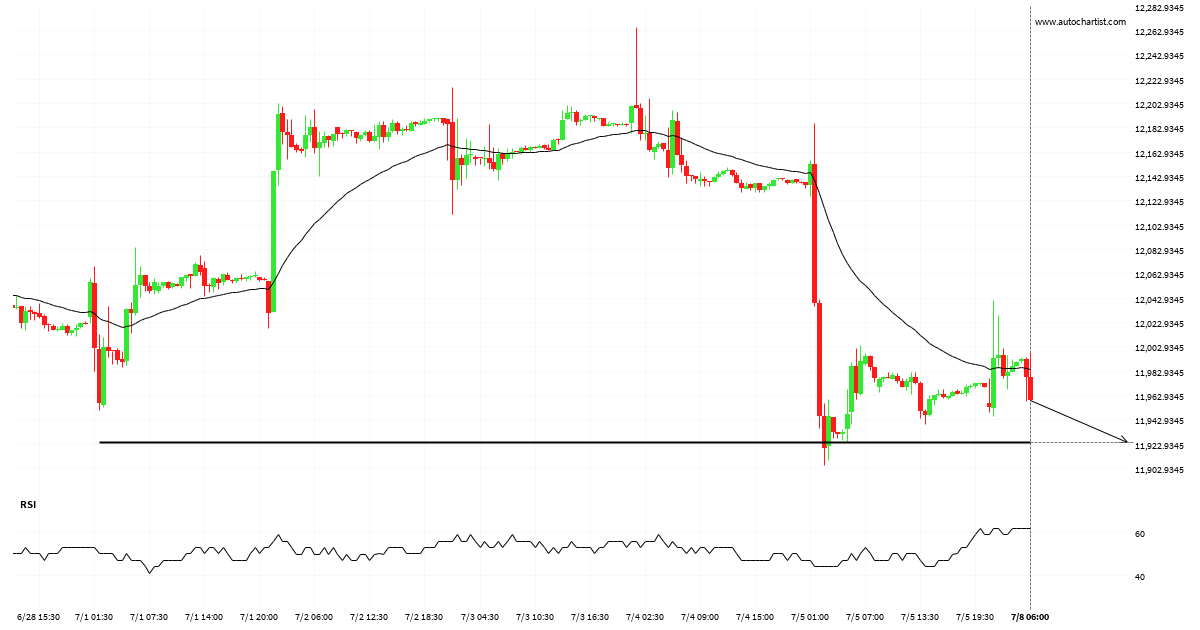
FTSE China A50 Index approaching support level
FTSE China A50 Index is about to retest a key horizontal support level near 11924.6797. It has tested this level 3 times in the recent past and could simply bounce off like it did last time. However, after this many tries, maybe it’s ready to start a new trend.
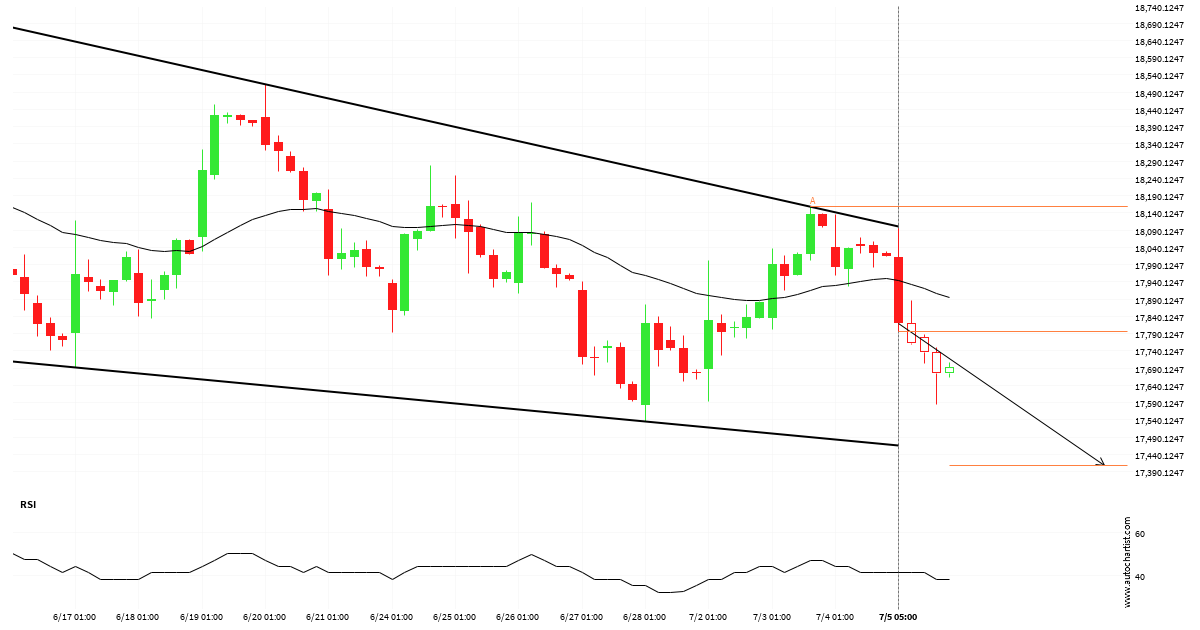
A potential bearish movement on Hong Kong 50 Index
Emerging Falling Wedge pattern in its final wave was identified on the Hong Kong 50 Index 4 hour chart. After a strong bearish run, we find Hong Kong 50 Index heading towards the upper triangle line with a possible resistance at 17408.8508. If the support shows to hold, the Falling Wedge pattern suggests a rebound […]
Support breakout on Hong Kong 50 Index
Hong Kong 50 Index has broken through a support line. It has touched this line numerous times in the last 17 days. This breakout shows a potential move to 17548.2793 within the next 3 days. Because we have seen it retrace from this level in the past, one should wait for confirmation of the breakout.
Big movement possible on FTSE China A50 Index
FTSE China A50 Index is once again retesting a key horizontal resistance level at 12208.0898. It has tested this level 3 times in the recent past and could simply bounce off like it did last time. However, after this many tries, maybe it’s ready to start a new trend.